
Figure 3.
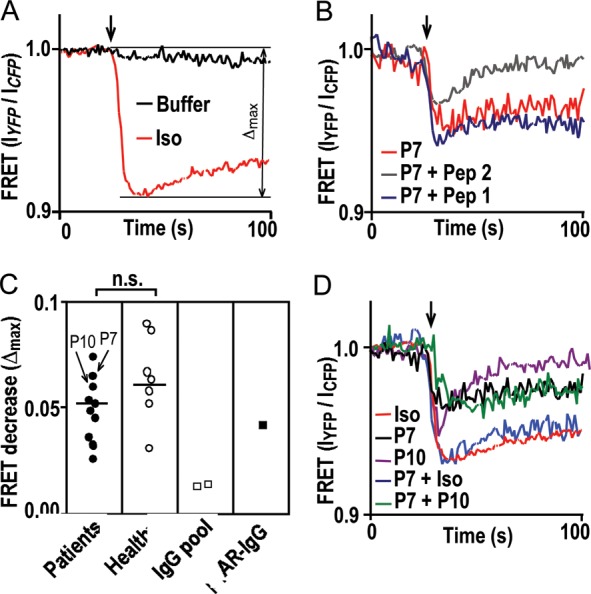
IgG impact on receptor conformation measured by a drop in FRET efficiency. (A) FRET response to 10−5 mol/L isoproterenol (red) or buffer (black). (B) FRET response to patient IgG (26.8 mg/L) without (red) or with pre-adsorption (1000-fold molar excess, 10 min, 37°C) with peptide analogues of the first (Pep 1, blue) or second (Pep 2, grey) extracellular loop of the human β1AR. (C) Comparison of FRET responses [quantification of Δmax demonstrated in (A)] to individual IgG (26.8 mg/L) from DCM patients (filled circle), matched healthy volunteers (open circle), commercial human-IgG preparations (open square) and rabbit β1AR antibodies13 (filled square) by the U test (bracket). P7 and P10 identify corresponding IgG samples in (B) and (D). Lines show medians. (D) FRET responses to simultaneous incubation with two individual patient IgGs (green) or sequential incubation with IgG and then isoproterenol (blue), compared with each agent alone [black (P7), magenta (P10), and red (Iso)].