
Figure 5.
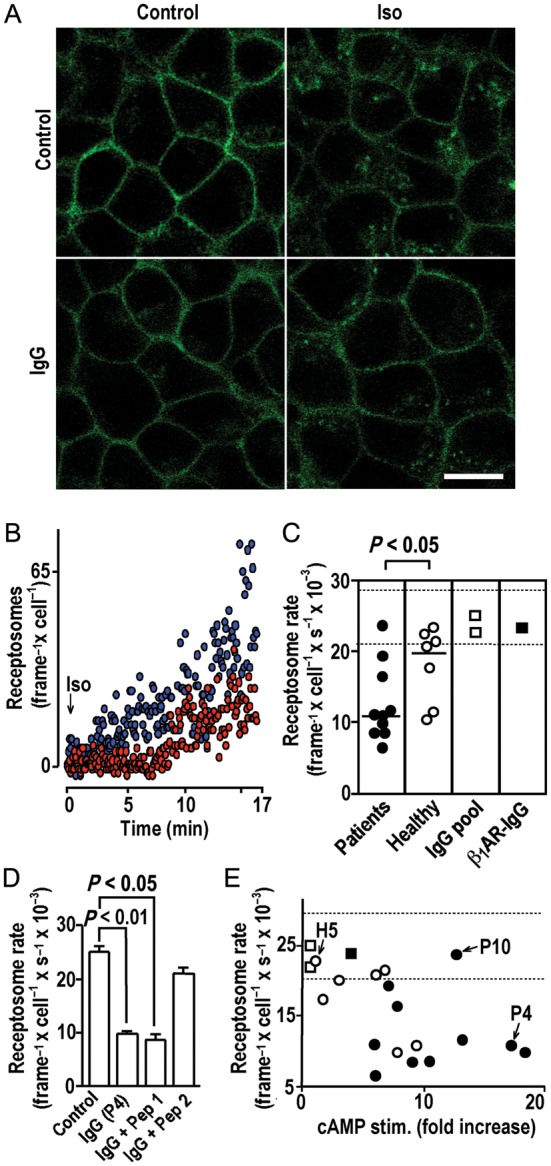
IgG inhibition of agonist-induced receptor internalization. (A) Confocal images (630-fold magnification, size bar of 30 μm at bottom right applies to all panels) of cells expressing YFP-fused human β1ARs before (top, left) or after (top, right) exposure to isoproterenol (10−5 mol/L, 37°C, 30 min) or after pre-incubation with autoimmune IgG (26.8 mg/L, 20 min, 37°C) (bottom, left) and subsequent isoproterenol exposure (bottom, right). (B) Internalized biofluorescent receptosomes quantified by TIRF following isoproterenol exposure (10−5 mol/L) without (blue) or with (red) IgG pre-incubation as in (A). (C) Impacts of IgG pre-incubation [as in (A)] on mean receptosome frequency averaged over 16.7 min of isoproterenol exposure. Bracket: U test. Dashed lines: 98% confidence band of the receptosome rate without IgG pre-incubation (n = 5). (D) Decrease of the isoproterenol-induced receptosome rate [mean ± SEM determined as in (C)] after IgG pre-incubation [as in (A)] with and without pre-absorption (1000-fold molar excess, 10 min, 37°C) with peptide analogues of first or second extracellular receptor loops (Pep 1 and 2, respectively). (E) IgG efficacies to stimulate cAMP and decrease agonist-triggered receptor internalization. H5, P4, and P10: index samples for comparison with Figures 4 and 6. Dashed lines as in (C).