
Figure 6.
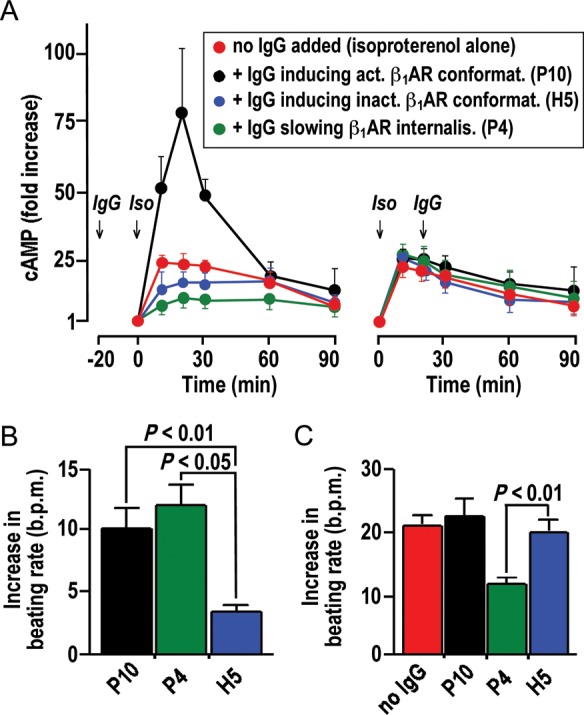
Modulation of cAMP stimulation and cardiomyocyte beating rate by IgG. (A) cAMP-time courses in HEK293 cells overexpressing human β1AR upon exposure to isoproterenol (10−6 mol/L). Left: IgG pre-incubation (50 mg/L, 20 min, 37°C). Right: IgG addition 20 min after isoproterenol. Red symbols in left and right: cAMP-time courses without IgG. Means ± SEM of triplicate determinations (for isoproterenol alone) or independent measurements with three independent IgG samples with similar properties. (B and C) IgG effects on basal beating rates (B) and chronotropic isoproterenol responses (C) of human embryonic cardiomyocytes subjected to sequential exposure to IgG (50 mg/L) and isoproterenol (10 μM). Data derived from continuous recordings, as shown in Supplementary material online, Figure S6. Mean ± SEM of measurements with three independent IgG samples with similar properties. P4, P10, H5: indexes referring IgG properties to corresponding data points in Figures 4 and 5.