Figure 1.
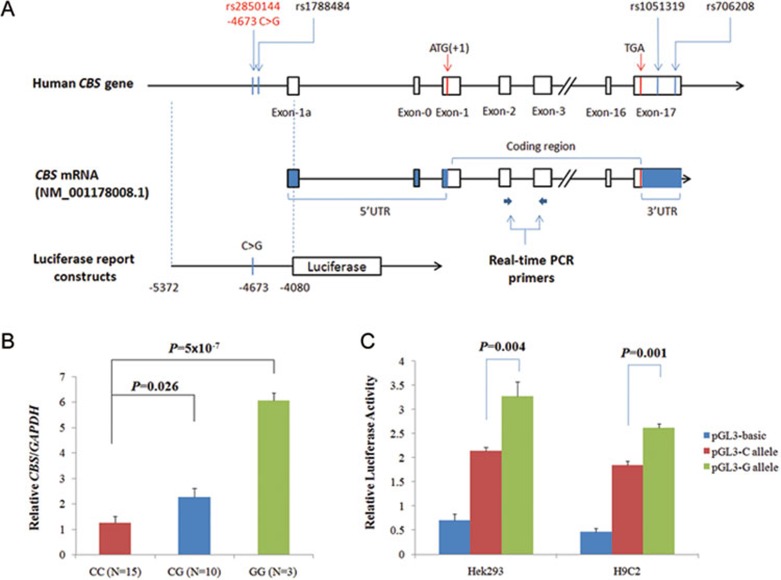
The CBS −4673C>G polymorphism upregulates CBS expression at the transcriptional level. (A) Schematic graph indicates the position of CBS −4673C>G polymorphism and the constructs for reporter gene assays in the CBS promoter. (B) Quantitative real-time PCR analysis of CBS in vivo mRNA level in 28 cardiovascular tissue samples with different −4673C>G genotypes. The actual values for each genotype group were as follows: CC = 1.26 ± 0.98; CG = 2.26 ± 1.10; GG = 6.04 ± 0.54. All values were normalized to the level of GAPDH and represented means ± SD of three independent experiments. (C) Luciferase expression was significantly increased in the minor G allelic construct compared with the major C construct in different cells (52% increases in HEK293 and 42% in H9C2 cells). The actual values in HEK293 cells were as follows: pGL3-basic = 0.70 ± 0.38; pGL3-C allele = 2.14 ± 0.23; and pGL3-G allele = 3.27 ± 0.90. The values in H9C2 cells were the following: pGL3-basic = 0.46 ± 0.22; pGL3-C allele = 1.85 ± 0.22; and pGL3-G allele = 2.63 ± 0.22. Each value represents mean ± SD of three independent experiments, and each experiment was performed in triplicate.

