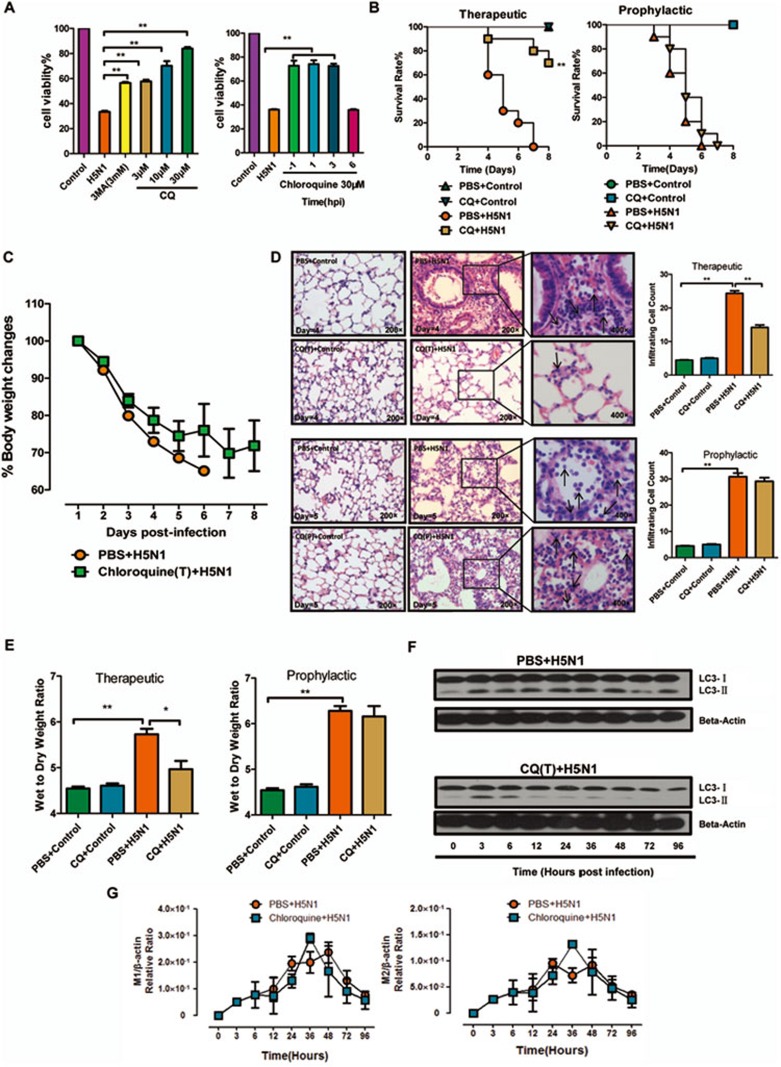
Figure 1.
Chloroquine (CQ) is a highly effective therapeutic but not prophylactic agent against avian influenza A H5N1 virus infection in mice. (A) MTS assay of A549 cells treated with 3-MA (3 mM) or chloroquine (3, 10 or 30 μM) 1 h before or treated with chloroquine (30 μM) 1, 3, 6 h after infection with control or H5N1 virus (4 MOI) for 48 h. (B) Survival rates of BALB/c mice receiving therapeutic treatment of CQ (i.p. 50 mg/kg) or vehicle control for 6 h and then once per day for 1 week after the intratracheal instillation of vehicle control or H5N1 virus (106 TCID50) and survival rates for the prophylactic treatment of CQ (i.p. 50 mg/kg) 2 h and 0.5 h before the intratracheal instillation of vehicle control or H5N1 virus (106 TCID50) (n = 10 mice per group). (C) Changes in body weights of BALB/c mice receiving therapeutic treatment of CQ as described above. The values are means ± SEM from ten mice. (D) Representative lung histopathology of BALB/c mice with therapeutic or prophylactic treatment of CQ as described above. Lung tissues were obtained on day 4 or 5 after virus infection. The black arrows pointed at the monocytes and neutrophils of the infiltrating cells. The bar graph shows the mean number of lung infiltrating cells ± SEM from 100 microscopic fields of each group (Original magnification was 200× microscopic fields from the lungs of BALB/c mice infected with H5N1 virus with or withour therapeutic or prophylactic treatment of CQ were partially magnified to 400× 100 fields were analyzed. n = 3 mice per group). (E) Wet/dry weight ratios of the lungs of BALB/c mice with therapeutic or prophylactic treatment of CQ as described above. Lung tissues were obtained on day 4 or 5 after virus instillation (n = 4-6 mice per group). (F) Western blot analysis of LC3-I and LC3-II in mouse lung tissue receiving therapeutic treatment of CQ as described above. Blots were analyzed with antibodies against the indicated proteins. (G) Real-time quantitative PCR analysis of M1's and M2's relative ratios to β-actin in mouse lung tissue receiving therapeutic treatment of CQ as described above (n = 3 mice per group).

