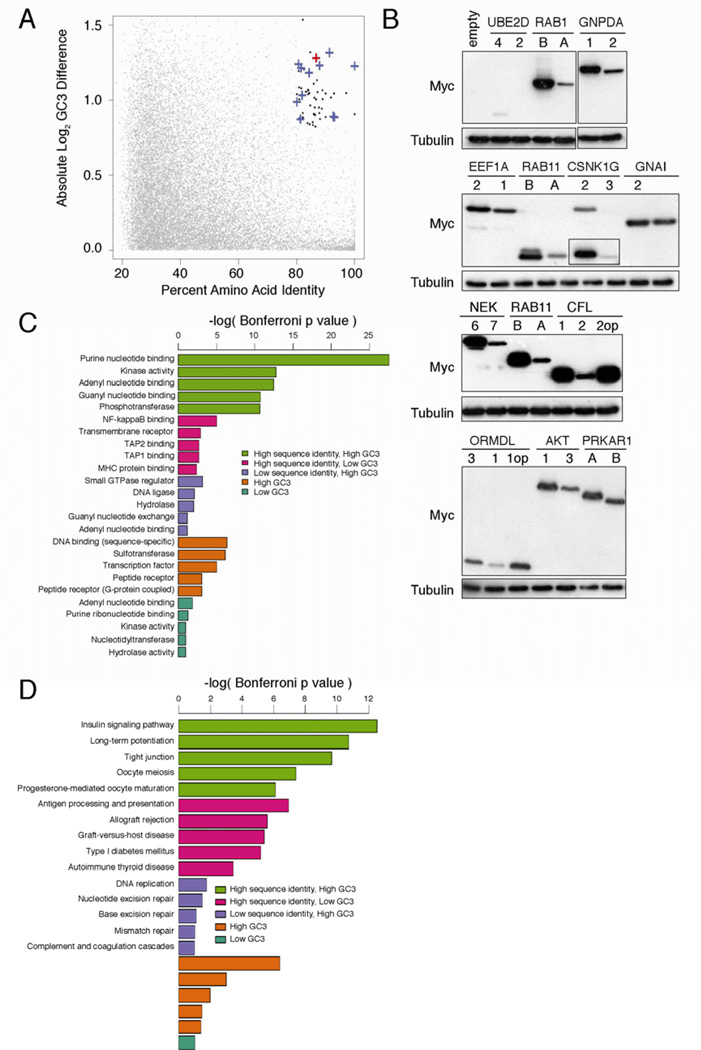
Figure 4. Gene pairs with divergent codon bias demonstrate correlating differences in expression and cluster in unique signaling protein classes.
(A) Percent amino acid identity versus log difference in CDS GC3 content of individual protein pairs identified by BLAST alignment (grey points). Black points: gene pairs with >80% identity and >1.8-fold difference in GC3 content. Blue cross: gene pair tested for protein expression. Red cross: HRAS-KRAS gene pair. (B) Immunoblot of lysates isolated from human 293 cells (ATCC) stably infected with the retrovirus pBabepuro encoding the indicated N-terminal FLAG-epitope tagged cDNAs corresponding to human genes pairs of high amino acid sequence identity that have a common (first) versus a rare (second) codon bias, or the gene pair enriched in rare codons after rare codons were optizimized (op) to common codons, with an αFLAG or αtubulin antibody. One of one to two experiments. Histogram comparing p values of (C) gene ontology categories or (D) KEGG signaling pathways enriched in lists of gene pairs with high amino acid sequence identity and high GC3 difference (green), high identity and low GC3 difference (pink), low identity and high GC3 difference (purple), or lists of genes with high GC3 content (brown) or low GC3 content (aquamarine). Detailed methodologies and regent descriptions are provided in Supplemental Experimental Procedures. See also Tables S1–3.

