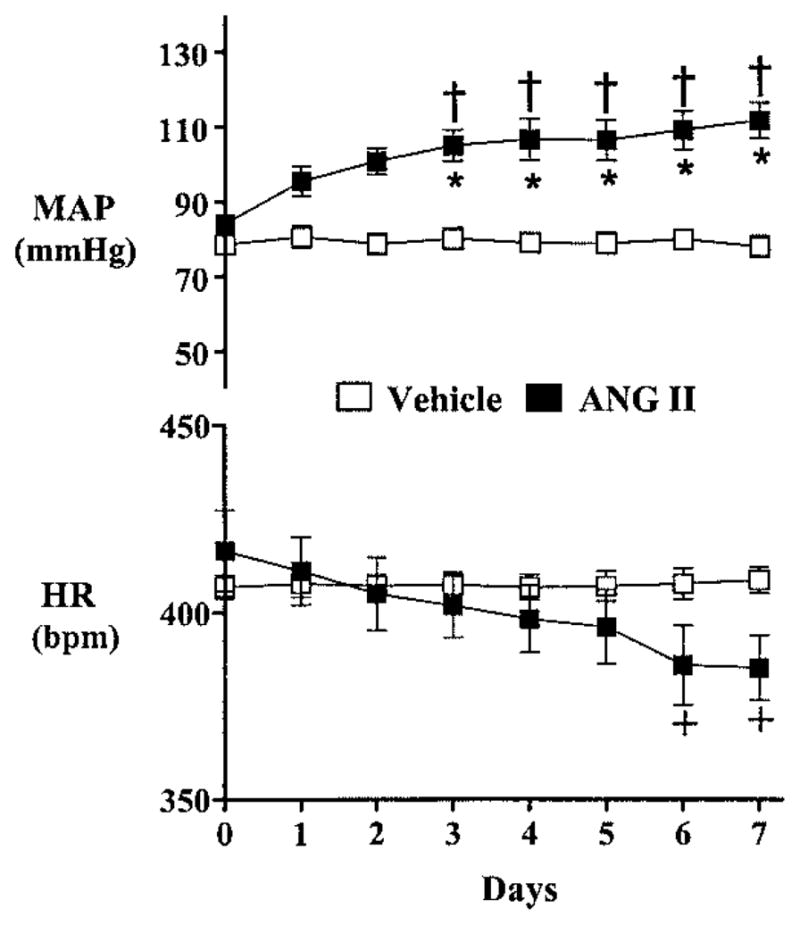
Figure 1.

Twenty-four-hour average MAP (top) and HR (bottom) in animals receiving intravenous infusion of either Ang II (■, n=5) or vehicle (□, n=5) for 7 days. +P<0.05 compared with baseline; †P<0.01 compared with baseline; *P<0.001 between Ang II–infused and vehicle-infused rats.
