
Figure 4.
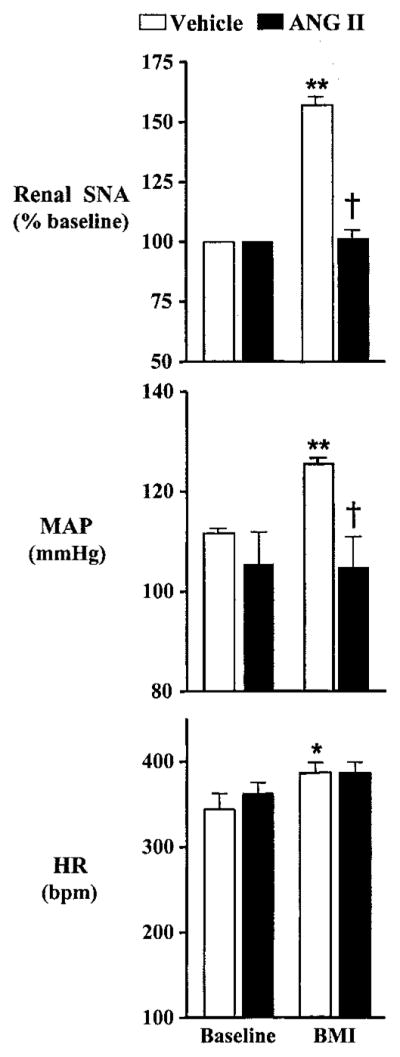
Group data showing renal SNA (top), MAP (middle), and HR (bottom) responses to unilateral PVN microinjection of BMI (0.1 nmol). Renal SNA (n=6 per group), MAP (n=7 vehicle; n=6 Ang II), and HR (n=7 per group) responses were significantly increased in response to PVN-microinjected BMI in vehicle-infused rats, whereas responses were significantly attenuated after 7 days of Ang II infusion. *P<0.05 compared with baseline; **P<0.01 compared with baseline; †P<0.01 compared with BMI in vehicle-infused animals.