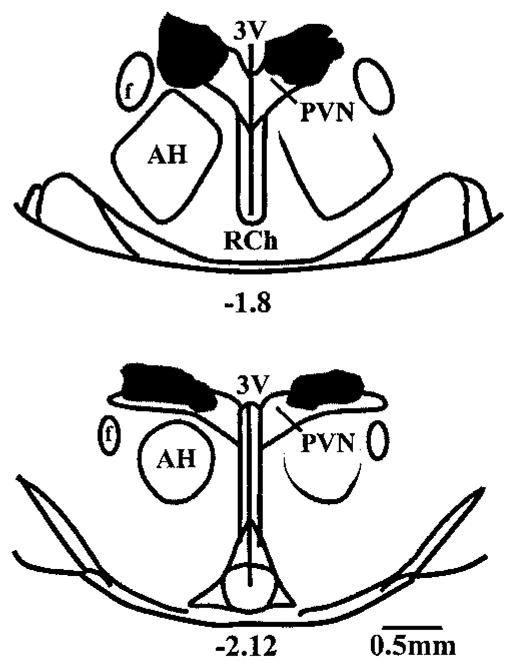
Figure 5.

Schematic drawings of rat hypothalamus in coronal section. Shaded areas approximate regions of hypothalamus exposed to microinjected BMI in rats infused with vehicle (right) or Ang II (left). Shaded areas were determined by injecting 100 nL of Evans blue dye (2%) after each experiment and tracing the outline of the dye observed on each 40-μm-thick section through the PVN. Outermost distribution of dye was determined by overlaying areas from similar rostral-caudal sections taken from different brains. Hence, the areas shown are larger than the dye distribution observed in any single brain but represent the widest possible distribution of injectate for all BMI-treated animals. Note that all PVN injections were made unilaterally (left side) but are shown bilaterally to distinguish injection areas for each treatment group. Numbers below drawings indicate distance (in mm) posterior to bregma. AH indicates anterior hypothalamus; f, fornix; 3V, third cerebral ventricle; and RCh, retro-chiasmatic area.
