
Fig. 6.
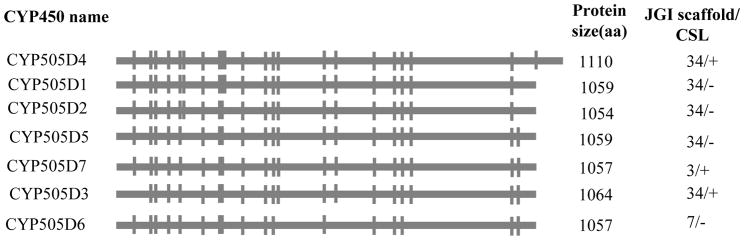
Gene structural organization of the CYP505 family P450s in P. chrysosporium (adapted and updated from Doddapaneni et al. 2005a). Horizontal bars represent the predicted coding regions (exons) whereas the intercepting vertical lines indicate intron locations. P450 protein sizes and locations in the genome (indicated with scaffold number from JGI version 2.0 genome) are shown for the individual member P450s. CSL: Coding strand location.