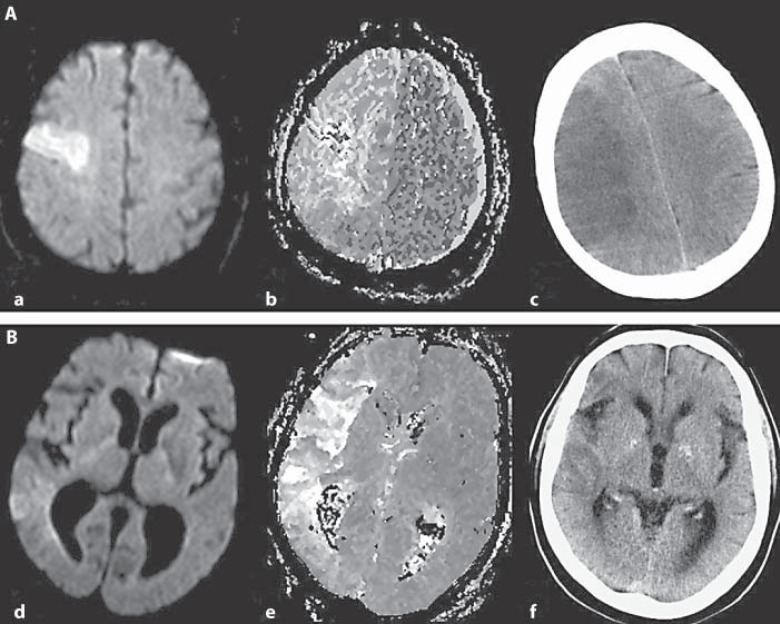
Fig. 1.
Different courses of tissue at risk. Examples of tissue fate in a patient developing anemia between stroke onset and follow-up CT scan (patient 1; A) and in a patient without anemia (patient 2; B). Displayed are DW (a, d) and PW (b, e) MR images on admission demonstrating a substantial mismatch in both patients. In patient 1, the follow-up CT image demonstrates infarct growth in comparison to the DWI lesion (c). In patient 2, no relevant change of the initial DWI lesion size was observed (f).

