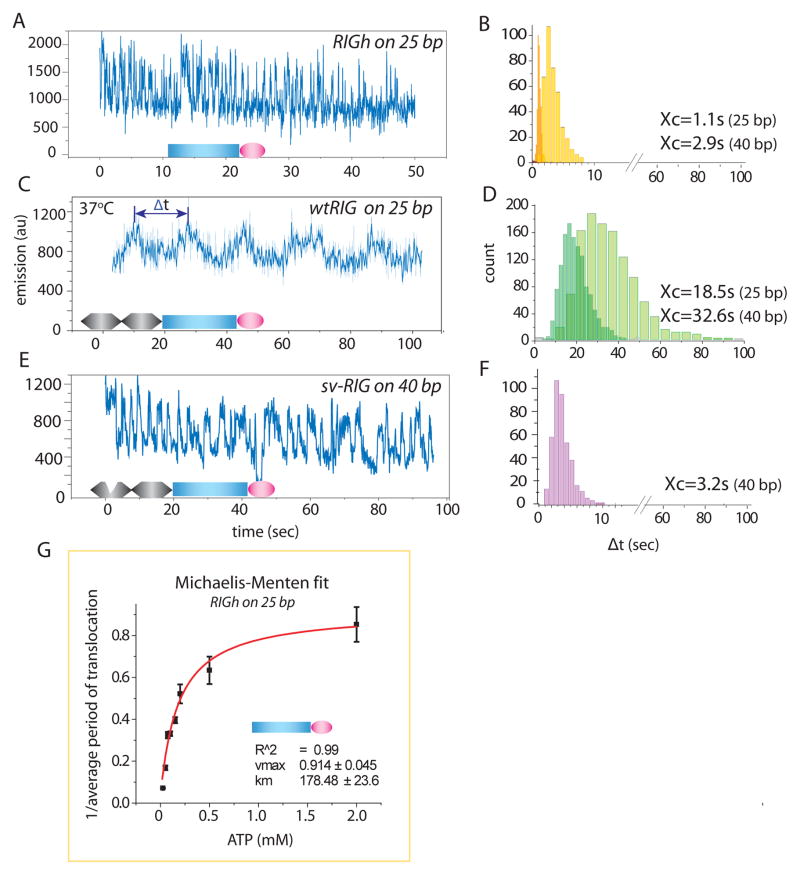
Fig. 2. RIG-I translocates on dsRNA and CARD is inhibitory.
A, C, E. 100nM RIGh (CARD-less mutant), wtRIG (RIG-I wild type) and svRIG (splice variant RIG-I) was added with 1mM ATP respectively at 37°C. The signal fluctuation represents RIG-I movement along dsRNA substrate. B, D, F. Dwell time analysis of periods denoted by Δt with a double-arrow (C) was measured for many molecules and plotted as histograms for RIGh (B), wtRIG (D) and svRIG (F) for 25bp and 40bp dsRNA. G. The inverse of average Δt, (tavg)−1, was plotted against [ATP] axis and fitted to Michaelis-Menten equation. The error bars denote standard deviation from three separate experiments each. The Vmax and Km values were 0.91 and 179μM respectively.

