


Fig 2. Integrated analysis of protein expression and the EMT signature.
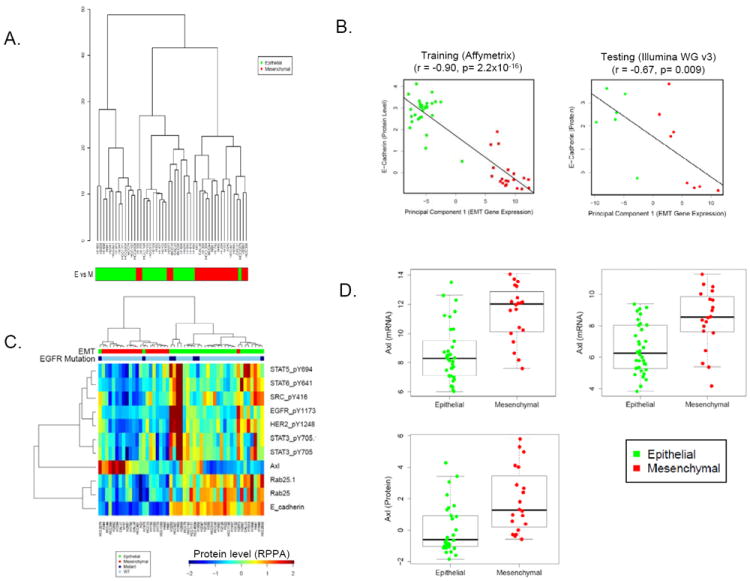
(A) RPPA analysis reveals that cell lines dichotomize into epitheial and mesenchymal groups based on their overall proteomic signature. (B) E-cadherin protein levels quantified by RPPA were strongly correlated with the EMT signature first principal component in the training and testing cell line sets. (C) Hierarchical clustering of proteins strongly associated with an epithelial or mesenchymal signature showed higher expression of EGFR pathway proteins and Rab25 in epithelial lines. (D) Axl expression was significantly higher in a subset of mesenchymal cell lines at the mRNA and protein levels.