Figure 1.
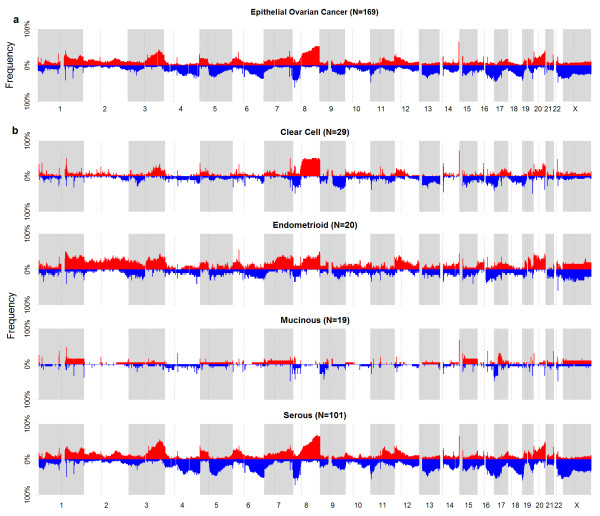
Overview of copy number aberrations in EOC from 3 datasets from chromosomes 1-X. Chromosomes are shown in alternating blocks of grey. The centromere for each chromosome is shown as a dotted line. (a) Frequency (%) of occurrence of amplification (red) and deletion (blue) from chromosome 1 to X in epithelial ovarian cancer from the merged 3 datasets. Major regions of alterations reported in other studies are similarly observed: e.g. chr 3, 8, 17, and 20. (b) Frequency (%) of occurrence in the 4 main histotypes of EOC. Threshold for frequency was set at LRR ≥ |0.2|. The frequency for serous tumors is similar to that in (a). However, frequency for the lower prevalent histotypes showed evident differences, indicating the molecular differences between the histotypes.

