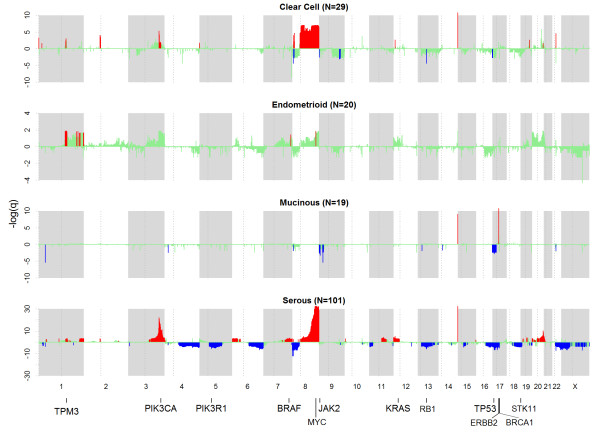
Figure 2.
Significance of copy number alterations (green) in clear cell, endometrioid, mucinous, and serous histotypes are shown in 4 horizontal tracks respectively. GISTIC q-values (y-axis) are shown as –log10. Regions that passed the statistical selection criteria (see Methods) are shown as: amplification (red) and deletion (blue). Some known cancer and putative genes are indicated at the bottom of the plots. ERBB2 in chr17 is shown to be amplified in the mucinous track. Note scale difference in y-axis for the histotypes.

