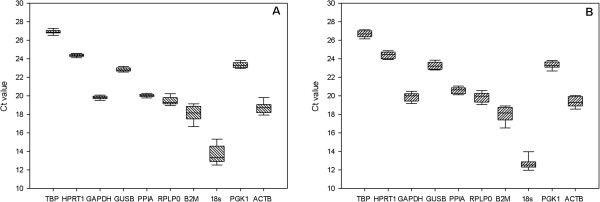
Figure 1.

The distribution of gene expression levels of candidate reference genes in hCEC (A) and hREC (B). Values are given as qRT-PCR Ct values. The boxes represent the 25 to 75 percentile ranges with medians (line in the box); the whiskers illustrate the 1 to 99 percentile of the samples.
