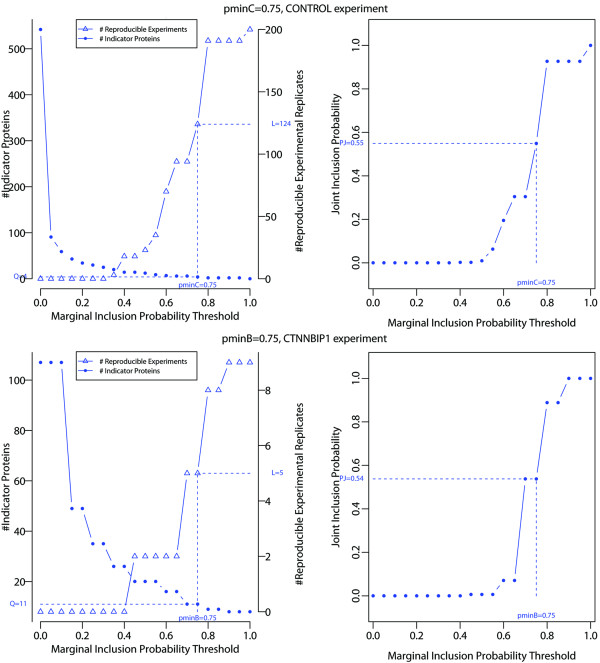
Figure 3.
Number of Indicator Prey Proteins ,and Reproducible Experimental Replicates ,(left) and the joint inclusion probability and (right) in the CONTROL (top) and CTNNBIP1 (bottom) AP-MS bait experiment. The number of Indicator Prey Proteins, Reproducible Experimental Replicates, and joint inclusion probabilities are indicated for the marginal inclusion probability thresholds and .

