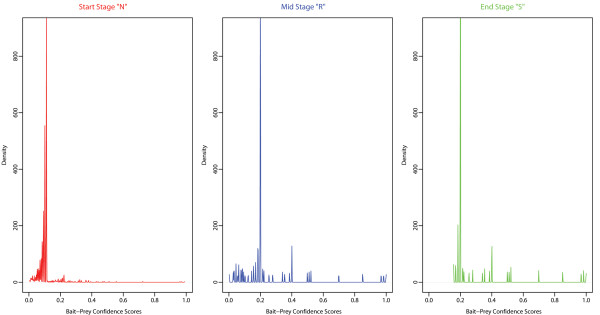
Figure 5.

Density distribution plots of bait-prey Confidence Scores at procedural stages “N”, “R” and “S” in the CTNNBIP1 AP-MS bait Experiment. Note the identical density scales and the re-distribution of Specific Prey Proteins (Confidence Score → 1) as the method progresses through the procedural stages: from the initial “Naïve” stage (“N”), to the “Reproducible” stage (“R”), and to the final “Specific” stage (“S”). Results are reported for the entire positive range ĈScutoff ∈ [0, 1] of Confidence Score cutoff and the marginal inclusion probability thresholds and .
