
Figure 9.
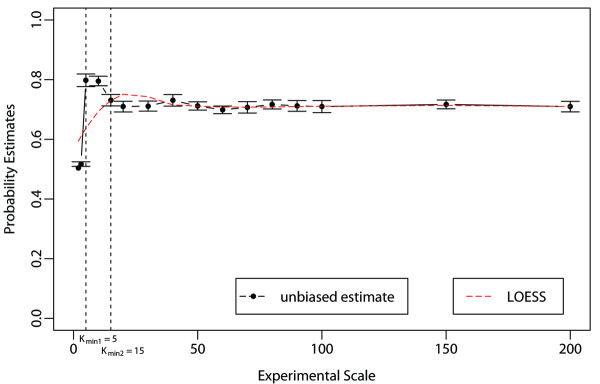
Stability diagnostic plot of the identification procedure on multiscale sets of experiments. Multiscale unbiased joint inclusion probability estimates is plotted against a range of experimental scale values for an arbitrary marginal inclusion probability threshold of . The plot also displays probability estimate standard errors, the change point () and the scatterplot smoothing curves fitted to the data (by LOESS local polynomial regression procedure). These curves are approximately horizontal-flat (i.e. show no trend) for K > Kmin.