
Figure 5.
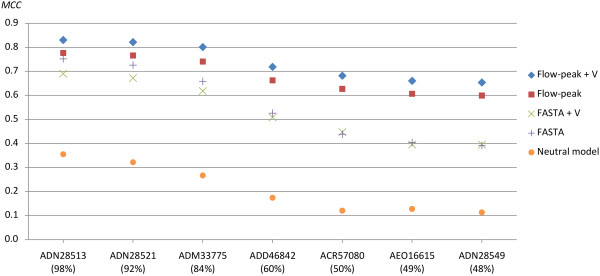
Alignment accuracy results for the different models. The figure shows the alignment accuracy through Matthews Correlation Coefficient (y-axis) of the homopolymer insertion/deletion recovery, for targets and various alignment models. The targets (x-axis) are given by Genbank identifier with the BLAST local identity in parenthesis. The models evaluated are; a 454 model using flowpeak information with and without validation (denoted + V) as well as without flowpeak information (FASTA input) with and without validation and finally a neutral (non-454-aware) model (FASTA input). The alignments were performed using HAXAT and default parameters for a 454 model (with flowpeak information: -S20 -D40 -h0.3 -k0.4, without flowpeak information: -S12 -D24 -h0.5 -k0.6) as well as the optimal parameters for the neutral (non-454-aware) model on 454-data, -S8 -D15.