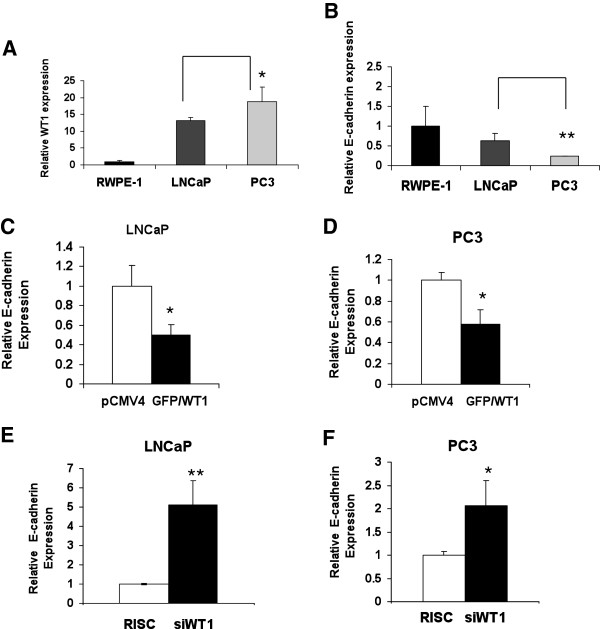
Figure 1.
WT1 and E-cadherin mRNA expression in prostate cancer (PCa) cells. RNA was isolated from RWPE-1, LNCaP and PC3 cells, reverse transcribed and (A) WT1 and (B) E-cadherin transcript levels were measured using TaqMan qRT-PCR. Values were normalized to 18S transcripts levels and data are presented relative to the non-neoplastic prostate epithelial cell line RWPE-1. Experiments were done in triplicate and reproduced twice. Student t-test was performed and significance was determined by comparing expression of WT1 (A) and E-cadherin (B) in PC3 cells with that of LNCaP cells (*p ≤ 0.05, **p ≤ 0.01). (C and D) E-cadherin mRNA expression levels in LNCaP (C) and PC3 (D) PCa cells transfected with pCMV4 or GFP/WT1 expression construct were measured using TaqMan qRT-PCR. Values were normalized as described in (A and B). Data are presented relative to pCMV4 transfected cells. Experiments were done in triplicate and reproduced three times. Student t-test was performed and significance was determined by comparing pCMV4 to GFP/WT1 transfected cells (*p ≤ 0.05). (E and F) E-cadherin mRNA expression in LNCaP (E) and PC3 (F) PCa cells transfected with RISC or siWT1 RNA oligonucleotides were measured as described in (A and B). Data are presented relative to RISC transfected cells. Significance was determined by Student t-test comparing RISC to siWT1 RNA oligonucleotides transfected cells (*p ≤ 0.05, **p ≤ 0.01) in three independent experiments.

