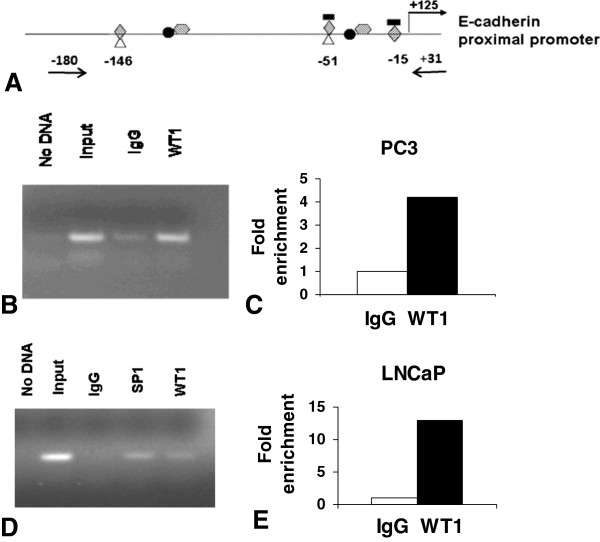
Figure 2.
WT1 binds to E-cadherin promoterin vivo. (A) Schematic diagram of E-cadherin promoter with transcription factors potential binding sites: WT1  EGR-1
EGR-1  , Snail
  , Twist
  , SP1
, SP1  . Positions of potential WT1 binding sites are listed and arrows indicate the location of PCR primers used for amplification of chromatin. ChIP assays were performed with chromatin from PC3 (B) and LNCaP (D) cells. Cells were transfected with GFP/WT1 construct and harvested after 48 hours. Chromatin was crosslinked and then immunoprecipitated with either IgG (negative control), WT1 (B, D) or SP1 (positive control) (D) antibody. Input or immunoprecipitated DNA was amplified by endpoint PCR, as described in Methods, using primers that amplify a 210 bp region of the E-cadherin proximal promoter. (B and D) Amplified products were analyzed by gel electrophoresis and representative images are shown. (C and E) Sybergreen qRT-PCR was performed to quantify the WT1 immunoprecipitated DNA from PC3 (C) or LNCaP (E) cells. Experiments were reproduced twice with different chromatin preparations and representative qRTPCR results are shown as fold enrichment compared to IgG.

