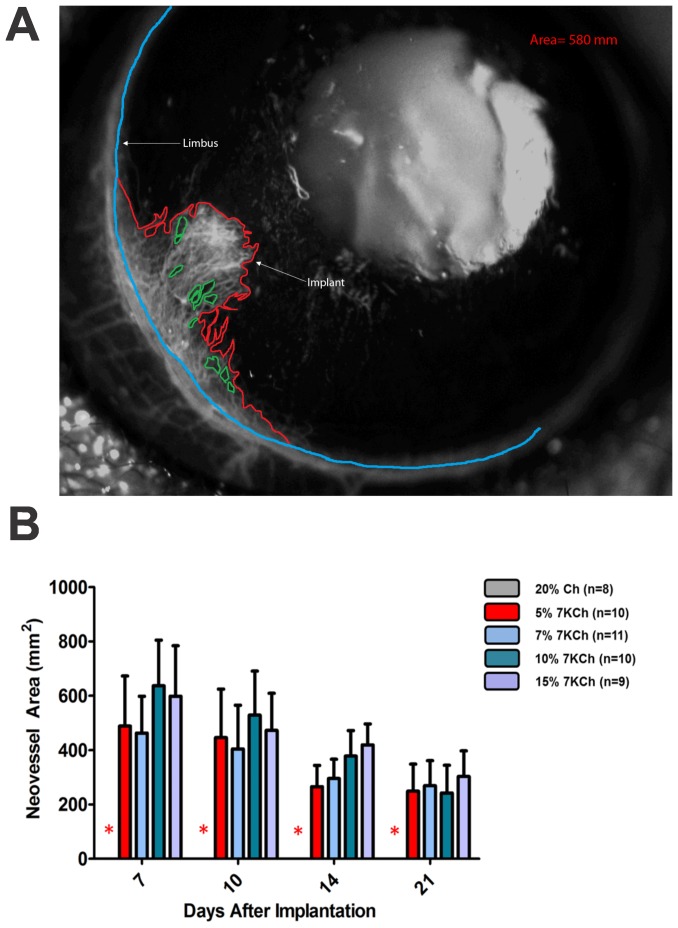
Figure 4. Technique used to quantify neovessel formation.
Vessels were imaged using a fluorescent dissecting microscope immediately after IP injection of fluorescein as described in Methods. A. Neovessel area was quantified using Nikon NIS elements hands free tool by delineating the base of neovessels (blue line), the border of the neovessels (red line) and subtracting areas with no vessels (green line). B. Graph showing neovessel area from the experiments described in Fig. 3 in mm2.

