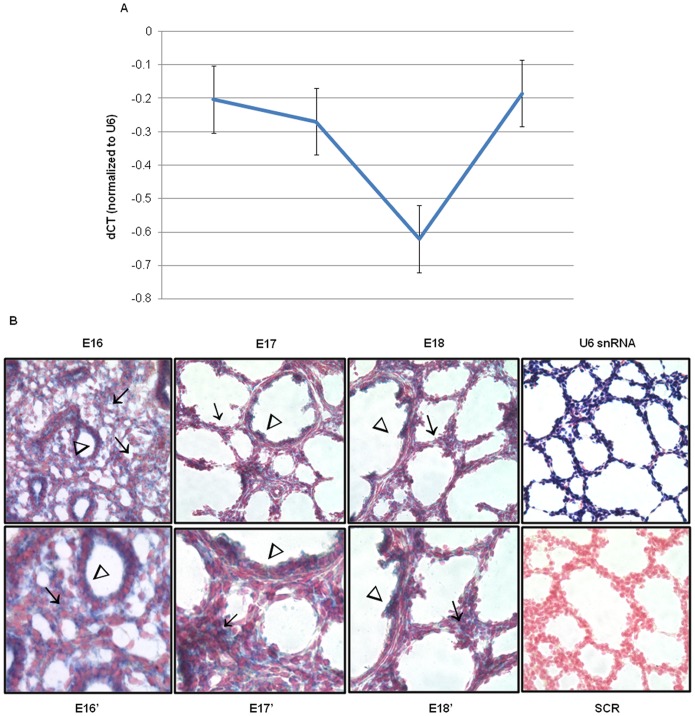
Figure 2. miR-130a temporal, spatial and cellular localization changes with advancing gestation.
(A) Quantification of total miR-130a levels in gestational days E15– E18 mouse fetal lungs was done by qRT-PCR. ΔCT values were calculated using U6 snRNA as an internal control. Mean ± SEM of N = 6 per gestation. (B) In situ hybridization was done using digoxigenin-labeled miR-130a probes on frozen sections obtained from E16– E18 mouse fetal lungs. U6 probes were used as a positive control and scrambled probes were used as a negative control. Sections were counterstained using Fast Red. E16–E18, SCR, and U6 snRNA images were taken at 40× magnification. E16′–E18′ are 80× magnification (N = 3; arrows point to mesenchyme; arrowheads point to epithelium).

