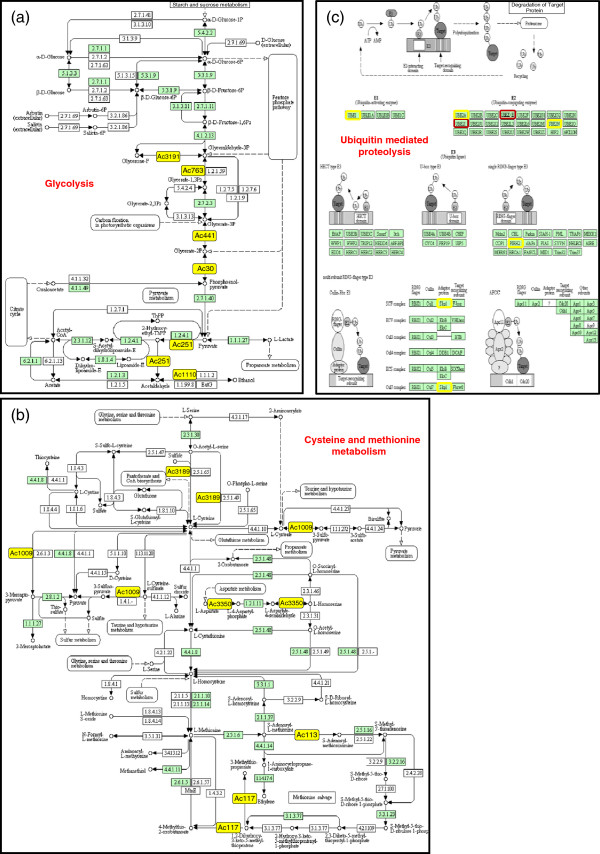
Figure 5.
KEGG pathway map analyses of differentially expressed genes (> 1.5-fold). (a) Glycolysis. (b) Cysteine and methionine metabolism. (c) Ubiquitin mediated proteolysis. Yellow and red boxes (filled and bordered) indicate up-regulated and down-regulated homologs, respectively. All pineapple homologs identified on the KEGG maps are shown in Table 1.

