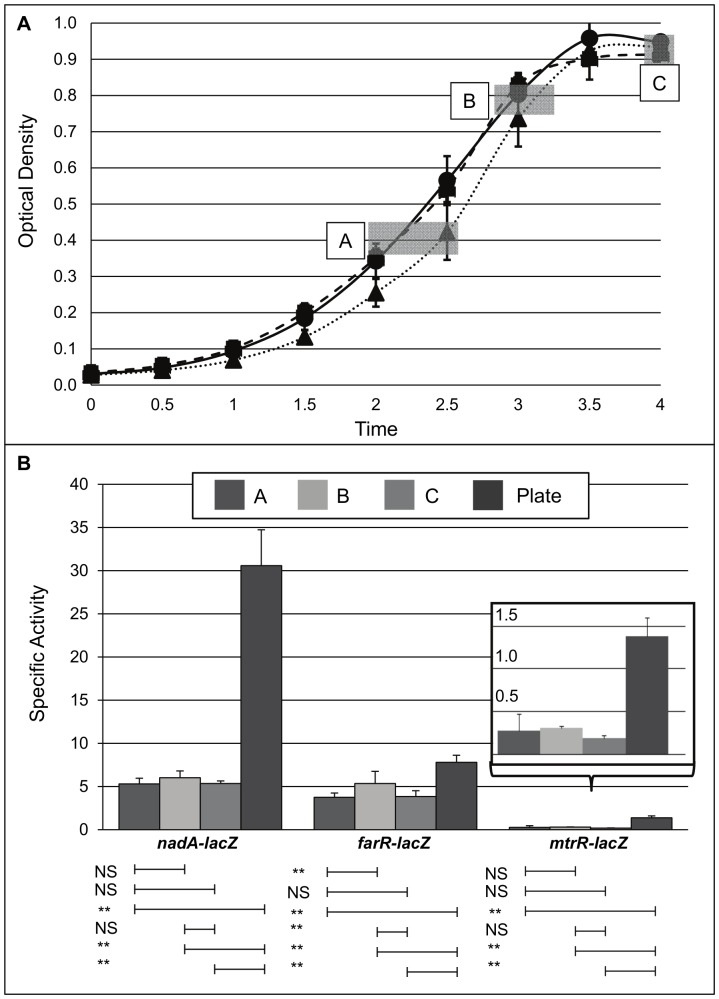
Figure 2. Growth phase-dependent expression of nadA, farR, and mtrR in N. meningitidis M7.
(A) Growth curve of strain M7 expressing lacZ fused to nadA (solid line; circle timepoints), farR (dotted line; triangle timepoints), and mtrR (dashed line; square timepoints) promoter regions measured by OD600 optical density. Boxed A, B, and C; timepoints for sample harvest. (B) Specific activity of β-galatosidase activity of lacZ fusions as indicated. Samples harvested from liquid culture at various growth phases (A, B, C) were compared with O/N growth on agar plates. Inset; magnified view of mtrR-lacZ expression. NS, not significant; **, P<0.01.

