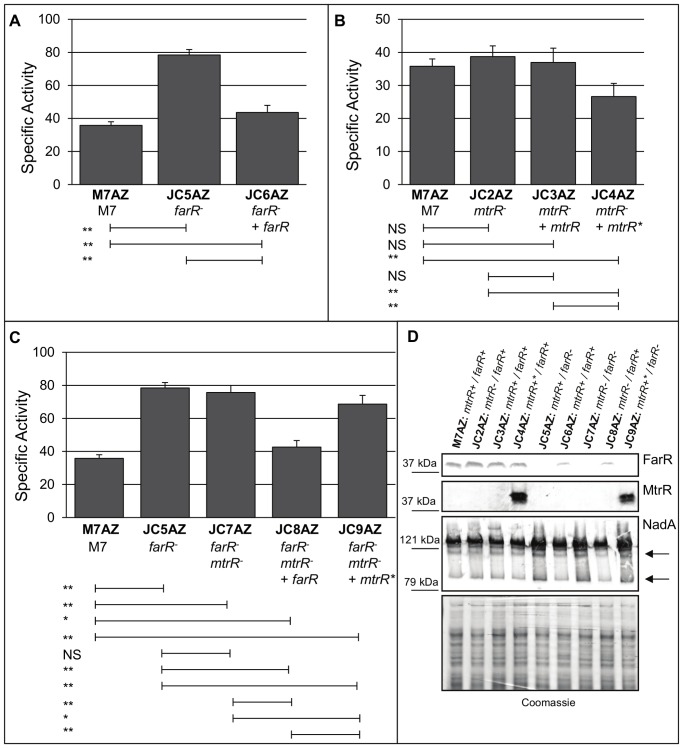
Figure 4. Expression of nadA by FarR and MtrR.
(A–C) Specific activity of β-galactosidase activity of nadA-lacZ in various M7 backgrounds as indicated. Strains over-expressing MtrR marked with a superscript asterisk. NS, not significant; *, P<0.05; **, P<0.01. (D) Western immunoblot analysis of NadA, FarR, and MtrR levels. Protein samples grown overnight on GC agar plates, collected, and analyzed by electropheoresis through 6% (NadA) or 12% (FarR and MtrR) SDS-PAGE gels followed by immunoblot with the respective antisera. Molecular weight standards are listed to the left. Coomassie-stained gel provided for protein level comparison. Arrows represent minor immunoreactive bands used to determine NadA steady-state differences across strains.

