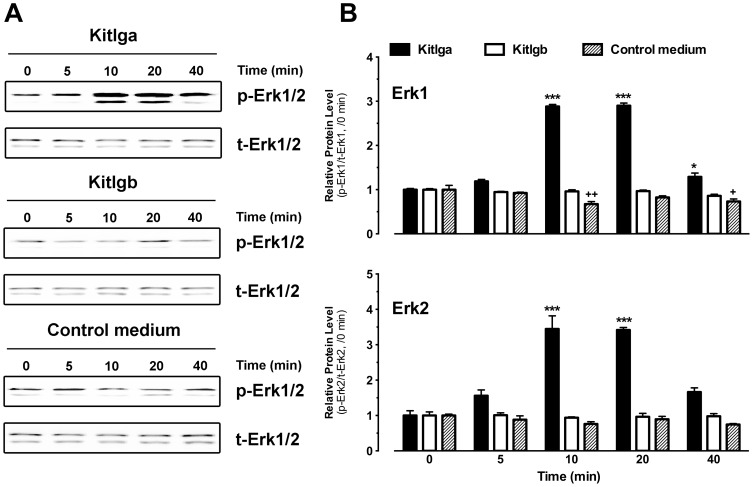
Figure 10. Effects of Kitlga and Kitlgb on MAPK phosphorylation in mature and ovulated oocytes.
(A) Western blot analysis of MAPK (Erk1/2) phosphorylation in response to Kitlga (200 µl Kitlga conditioned medium+200 µl control medium per ml), Kitlgb (400 µl/ml Kitlgb conditioned medium) and control medium (400 µl per ml). (B) Densitometric quantification of Erk1 (upper) and Erk2 (lower) phosphorylation. The data were normalized to total Erk1 or Erk2 and expressed as the fold change compared to the first group at time 0 min (mean ± SEM, n = 3). */+ P<0.05; ***/+++ P<0.001. p-Erk1/2, phosphorylated Erk1/2; t-Erk1/2, total Erk1/2.

