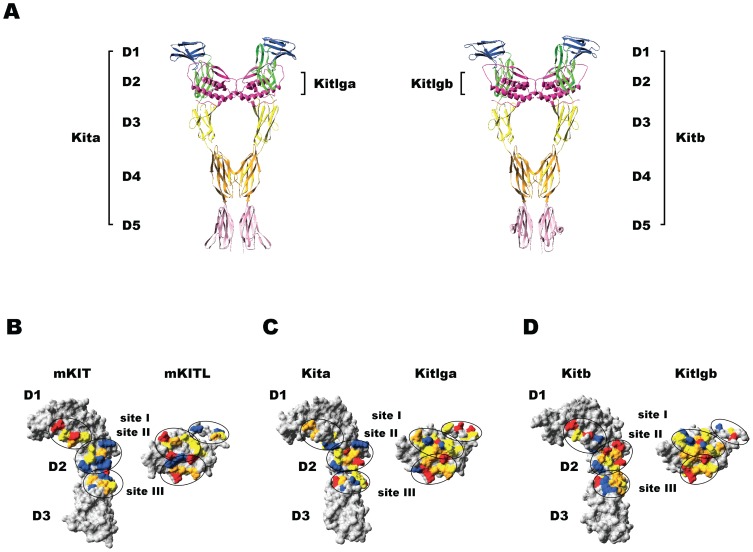
Figure 11. Molecular modeling of the three-dimensional structures of zebrafish Kit ligands (Kitlga and Kitlgb) and receptors (Kita and Kitb).
(A) Ribbon model of the Kitlga-Kita (left) and Kitlgb-Kitb (right) complexes. The motif D1 is colored in blue, D2 in green, D3 in yellow, D4 in orange, and D5 in pink. Kit ligands are colored in magenta. (B–D) Surface models of the interphase of the mouse KITL-KIT (B), zebrafish Kitlga-Kita (C) and Kitlgb-Kitb (D) complexes. The Kit receptor part involving D1, D2 and D3 is shown on the left and the ligand part is on the right. The amino acids with negative charge, positive charge, polar and hydrophobic side chains are shown in red, blue, orange and yellow, respectively. The ligand-receptor binding sites (site I, site II, and site III) are circled.

