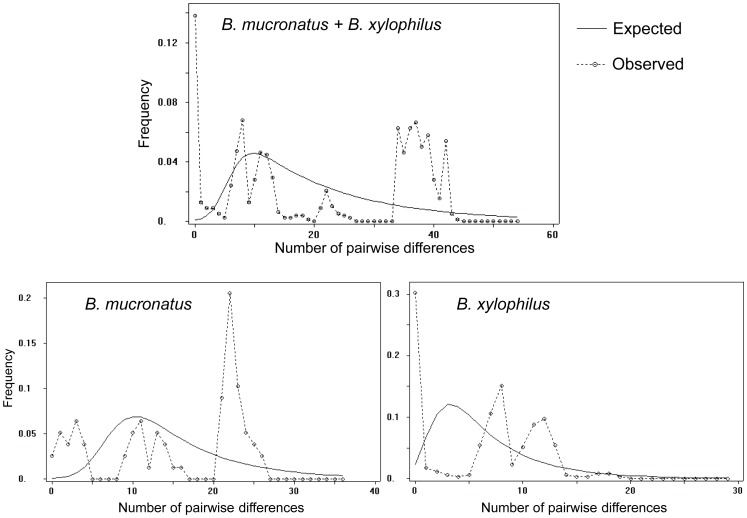
Figure 5. Mismatch distributions of cytochrome c oxidase subunit I (COI) haplotypes for Bursaphelenchus xylophilus and B. mucronatus isolates (combined and separated).
The number of differences between pairs of sequences is given on the horizontal axis with relative frequencies represented on the vertical scale.

