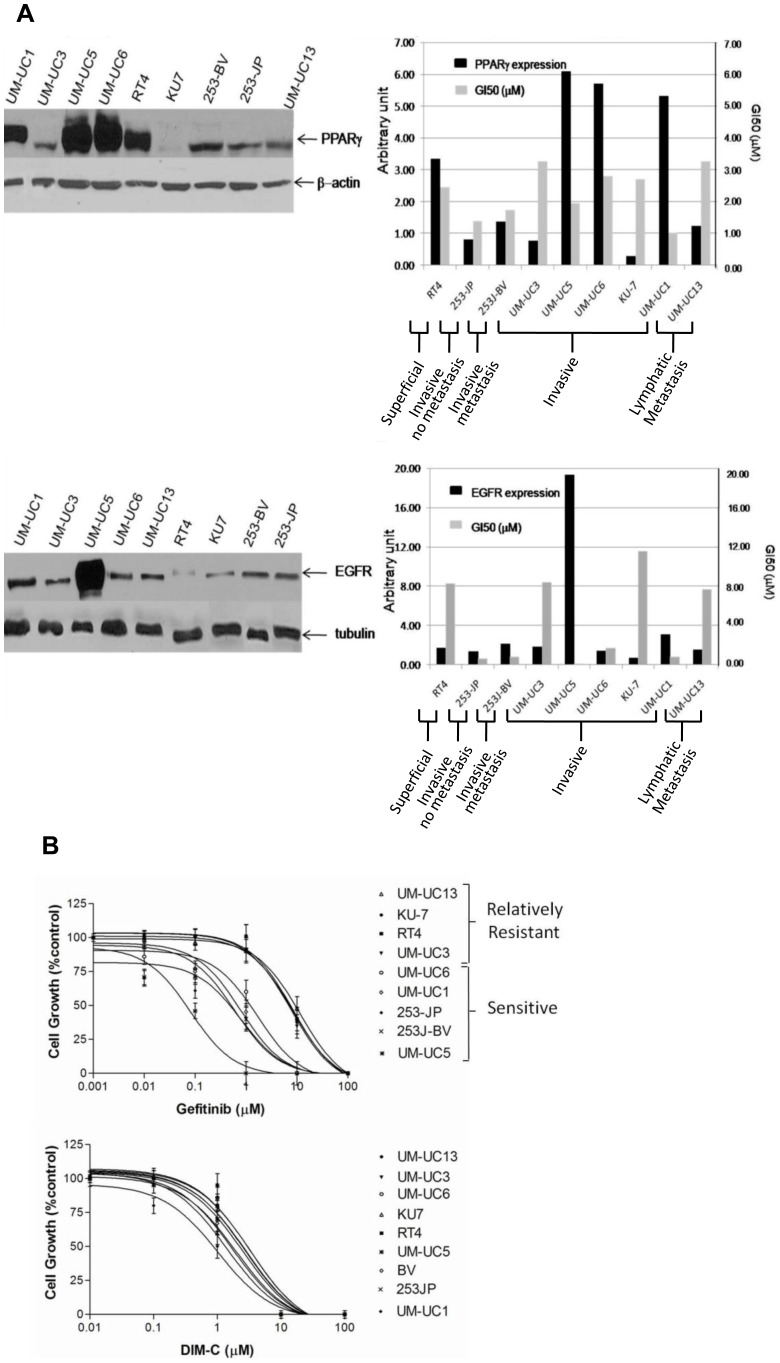
Figure 1. Baseline expression of PPARγ and EGFR.
(A) Expression of PPARγ and EGFR relative to endogenous levels of β-actin and tubulin, respectively, and represented in units among 9 bladder cancer cell lines reflecting different stages of the disease (from Superficial to Invasive & no Metastasis, Invasive and Lymphatic Metastasis). (B) Dose-response of bladder cancer cell lines to PPARγ agonist (DIM-C) and EGFR inhibitor (gefitinib). The GI50 value was defined as the mean concentration of drug that generates 50% of growth inhibition as compared to controls.

