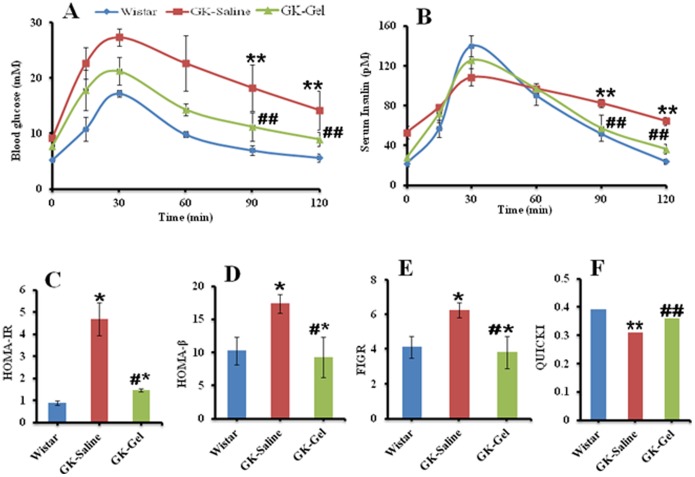
Figure 2. Intraperitoneal glucose tolerance test.
The time courses of serum levels of (A) glucose and (B) insulin are expressed as mean ± SD. (C) HOMA-IR, (D) HOMA-β, (E) FIGR and (F) QUICKI were also calculated by using the values of serum levels of glucose and insulin. n = 4 for wistar rats, n = 5 for both groups of GK rats. *, P<0.05; **, P<0.01; compared to wistar rats groups. #, P<0.05; ##, P<0.01 compared to GK-Saline group.

