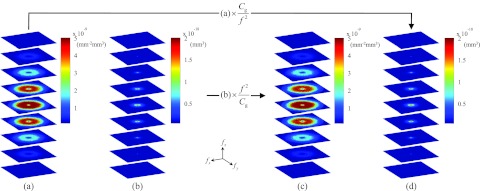
Figure 2.

Axial cuts through the 3D NPS. Frequency range along each axis is [−6.25, 6.25] mm−1. (a) and (b) NPS of ACT and DPC-CT, respectively, measured from experimental data. (c) The NPS of ACT calculated from the experimental NPS of DPC-CT in (b). (d) The NPS of DPC-CT calculated from the experimental NPS of ACT in (a).
