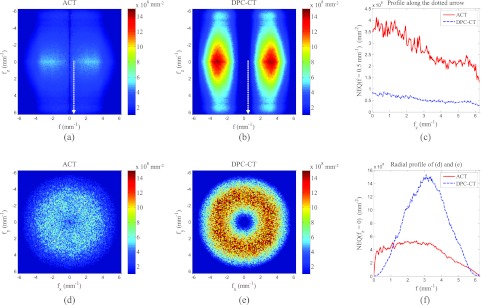
Figure 5.

2D planes through the 3D NEQ. (a) and (b) Averaged NEQ(f, fz) while (d) and (e) show a central axial plane of NEQ(fx, fy) with fz = 0. (a) and (b) show less uncertainty because of the radial averaging. (c) shows line profiles of the NEQ along the dotted arrow in (a) and (b). (f) shows the radial profile of (d) and (e).
