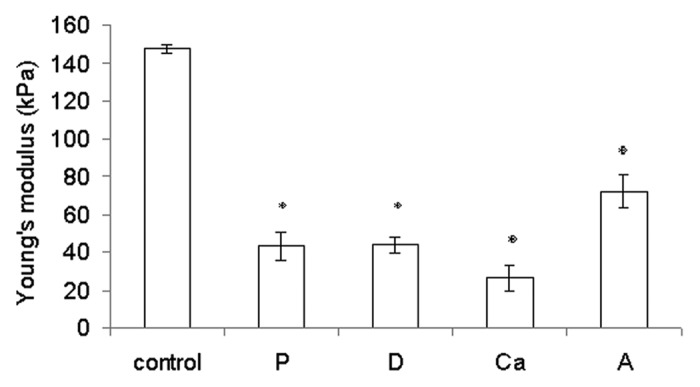
Figure 3. Young’s modulus of the rehydrated samples. Data are presented as the mean ± SD (n = 6). *Indicates data significantly different from the control sample (p < 0.05).

Figure 3. Young’s modulus of the rehydrated samples. Data are presented as the mean ± SD (n = 6). *Indicates data significantly different from the control sample (p < 0.05).