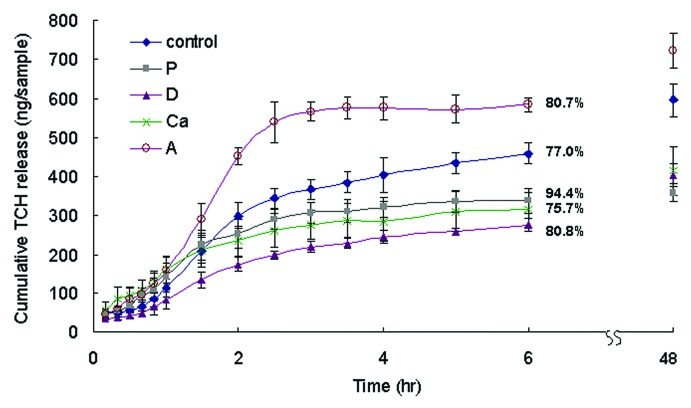
Figure 6. The cumulative TCH release of different samples over 6 h in PBS. Data are presented as the mean ± SD (n = 6). The total amount of TCH released within 48 h was the amount of TCH loaded on the sample. The percentages of TCH released after 6 h is shown on the figure. The cumulative amounts of TCH released from sample A at 6 h and 48 h were higher than those of the control, while those of samples P, D and Ca were lower (p < 0.05).

An official website of the United States government
Here's how you know
Official websites use .gov
A
.gov website belongs to an official
government organization in the United States.
Secure .gov websites use HTTPS
A lock (
) or https:// means you've safely
connected to the .gov website. Share sensitive
information only on official, secure websites.
