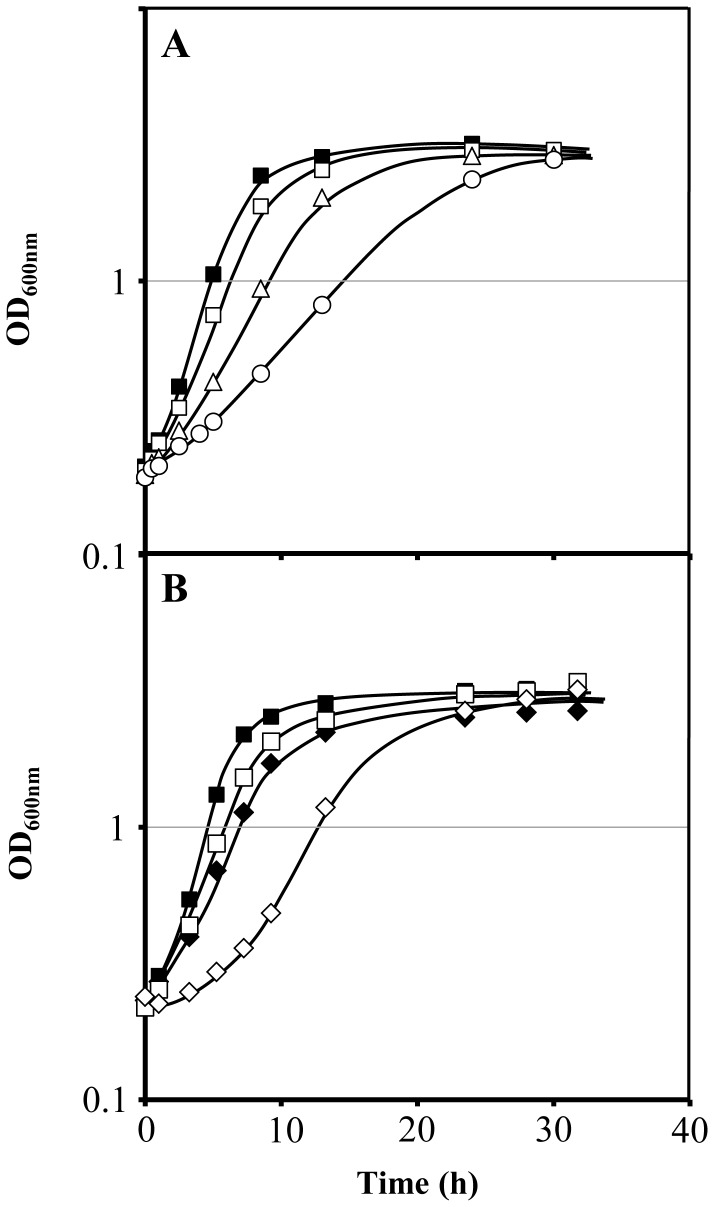
Figure 1. Growth curves of S. cerevisiae BY4741 parental strain and fps1Δ deletion mutant under ethanol stress.
(A) Comparison of the growth curves of S. cerevisiae BY4741 in the absence (▪) or presence of 2% v/v (□), 4% v/v (Δ) and 6% v/v (○) of ethanol. (B) Comparison of the growth curves of S. cerevisiae BY4741 (▪, □) and the corresponding deletion mutant fps1Δ (♦, ◊) in the absence (closed symbols) or presence of 2% v/v of ethanol (open symbols).

