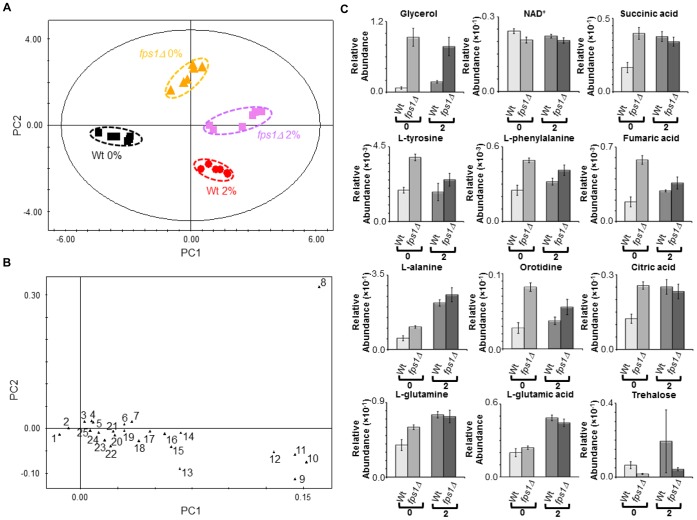
Figure 4. Comparison between the endo-metabolome of BY4741 parental strain and of fps1Δ deletion mutant.
Yeast cells were harvested during the exponential phase of growth (OD600 nm = 1.0) in the same basal medium supplemented with 0 or 2% v/v of ethanol. (A) 2D score plot displaying the space formed by the two first principal components (R2X for PC1 equal to 0.525 and R2X for PC2 equal to 0.321), (B) 2D loading plot displaying the space formed by the two first principal components (with characteristic bins for a set of metabolites) and (C) relative abundances of different metabolites in the endo-metabolome of the parental strain and the fps1Δ deletion strain during the exponential growth phase (OD600 nm = 1.0) in the presence of different ethanol concentrations (0 and 2% v/v). Experimental values are means of six independent experiments with standard deviation error bars. Key: 1 NAD+, 2 NADP+, 3 L-tyrosine, 4 Fumaric acid, 5 L-phenylalanine, 6 Citric acid, 7 Succininic acid, 8 Glycerol, 9 L-glutamic acid, 10 L-leucine, 11 L-methionine, 12 L-alanine, 13 L-ornithine, 14 L-threonine, 15 L-valine,16 L-glutamine, 17 L-aspartic acid, 18 L-malic acid, 19 L-histidine, 20 L-serine, 21 L-asparagine, 22 L-lysine, 23 Thiamine, 24 NADH and 25 L-proline.

