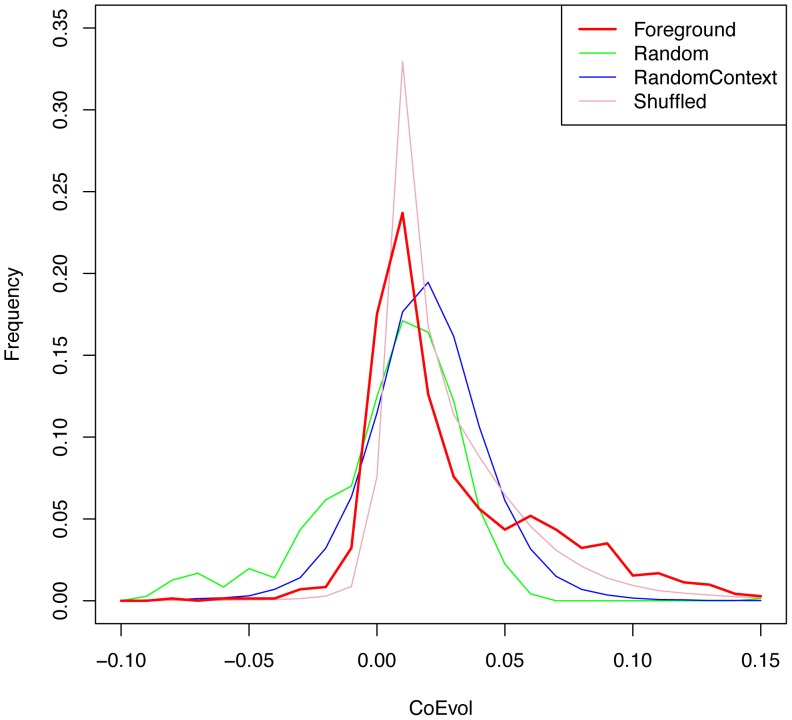
Figure 2. The distribution of CoEvol values for scope 1.
Shown are CoEvol values for Foreground, Random, RandomContext and Shuffle controls. Values for RandomContext are included after correcting for a shift in the distribution of tree likelihoods (see Methods for details). Relative to the most stringent control – Shuffle, the Foreground CoEvol values are significantly greater (Mann-Whitney U test p-value = 0.02, Kolmogorov-Smirnov test p-value = 1.1e-12).

