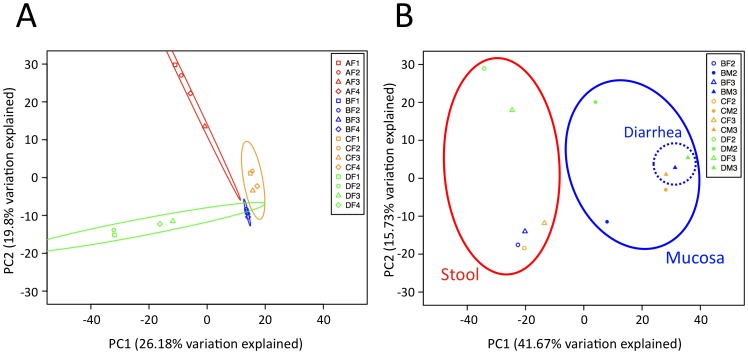
Figure 3. Stool microbiotas are highly individualized and mucosal microbiotas assimilate due to osmotic diarrhea.
(A) PCA of stool samples according to individuals and treatment periods shows individual specific clustering of stool samples. The principal components 1 & 2 accounting for up to 26.18% variability are shown including 87% confidence ellipses. The inset panels identify the respective samples (A, B, C, D denote subjects; F denotes stool sample; M denotes mucosa sample; time-points: 1, 2 pre-diarrhea, 3 diarrhea, 4 post-diarrhea). (B) PCA of stool and the corresponding mucosa samples before and during diarrhea. The principal components 1 & 2 accounting for up to 41.67% variability are shown. Stool and mucosal communities are significantly different (P = 0.0002, Student’s t-test) and are clearly separated from each other. Mucosal communities obtained before (time-point 2) and during diarrhea (time-point 3) are significantly different (P = 0.0044, Student’s t-test) and cluster independent of the individual, indicating a convergence of the individualized microbiotas.

