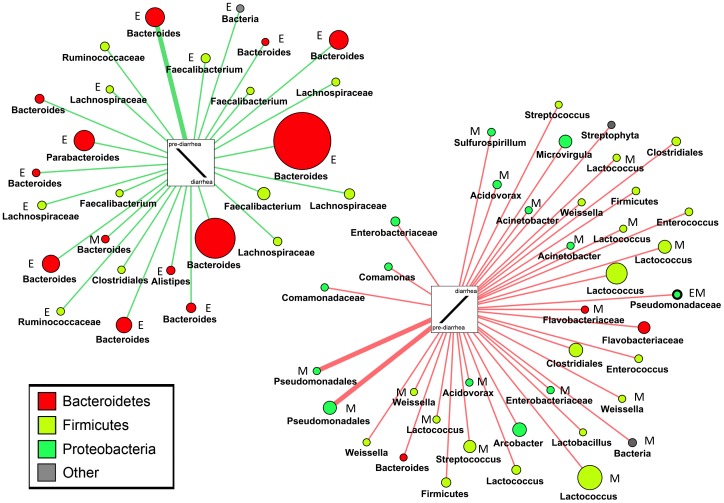
Figure 8. Changing mucosal OTUs visualized with an association network (Viz).
OTUs (distance = 0.03) are shown with their respective abundance change comparing pre-diarrhea (time-point 2) with diarrhea (time-point 3) samples. Only OTUs are displayed that were assigned to a respective reaction pattern in at least two individuals (corresponding to thin lines). The width of lines correlates with the number of individuals in whom an OTU was assigned to a specific pattern. Size of nodes correlates with the mean relative abundance change comparing pre-diarrhea to diarrhea samples. OTUs are colored according to their phylum membership and named according to the taxonomic rank conferred by the RDP classifier (80% identity threshold). M denotes significantly changed according to Metastats analysis (P<0.05); E denotes significantly changed according to edgeR analysis (P<0.05). OTUs identified by both biostatistical methods are highlighted with a bold outline. Note the increase of various Proteobacteria, including opportunistic pathogens (e.g. Pseudomonas, Acinetobacter, Arcobacter), and also an increase of Firmicutes due to diarrhea (right); Bacteroidetes generally occurred together with Faecalibacterium, which was mirrored by an increase in stools. Note the skew of edgeR-identified OTUs towards the decreasing pattern (left) and of Metastats identified OTUs towards the increasing pattern (right).

