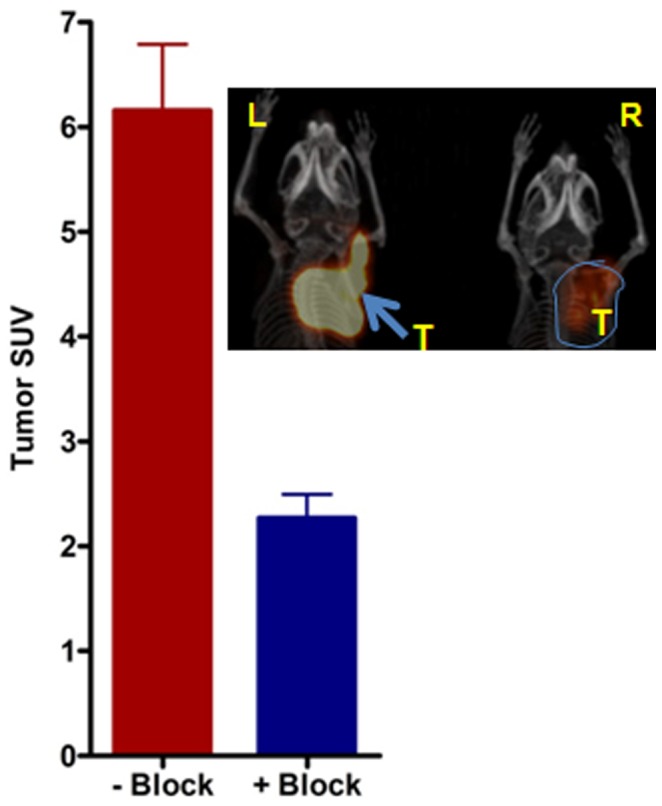
Figure 6. Graph representing in vivo blocking of 64Cu-CB-TE1A1P-LLP2A.

Averaged tumor MIP SUV’s (N = 4) calculated from small animal PET images in the presence and absence of the blocking agent, LLP2A. Inset-Representative MIP image showing mice with similar tumors in the nape of the neck imaged in the absence (L) and presence (R) of the blocking agent (LLP2A). Mice were imaged with small animal PET and 64Cu-CB-TE1A1P-LLP2A at 2 h post-injection (0.9 MBq, 0.05 µg, 27 pmol, (SA: 37 MBq/µg). Blocking dose: ∼200 fold excess than the tracer amount. P<0.05.
