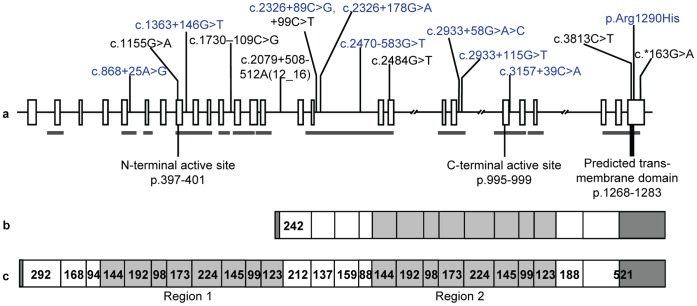
Figure 1. Schematic representation of the equine ACE gene structure.
The genomic structure (a) depicts exons (boxes), introns (bars) and the locations of polymorphisms identified in this study. The broken bars indicate where sequencing was not completed through introns. The grey bar beneath the gene indicates areas screened in the pools for polymorphisms. Common polymorphisms used for haplotype analysis are indicated in blue font, and the active sites and transmembrane domain are indicated. The predicted testicular (b) and endothelial (c) transcripts, including exon sizes (bp), are shown. The duplicated areas of the gene (regions 1 and 2) are shaded in light grey and the predicted UTR’s are shaded dark grey.

