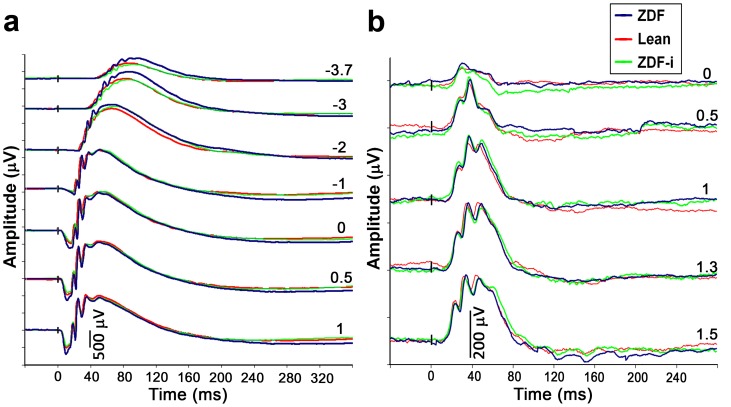
Figure 2. Electroretinograms (ERGs) of all experimental groups.
A series of ERG traces were elicited by flashes of increasing intensity (denoted on right as value of log cd*s/m2 for each trace) under scotopic (a) and photopic (b) conditions. The traces shown are from an animal representative of each experimental group at 16 weeks of age. ZDF-i, insulin-treated ZDFs.

