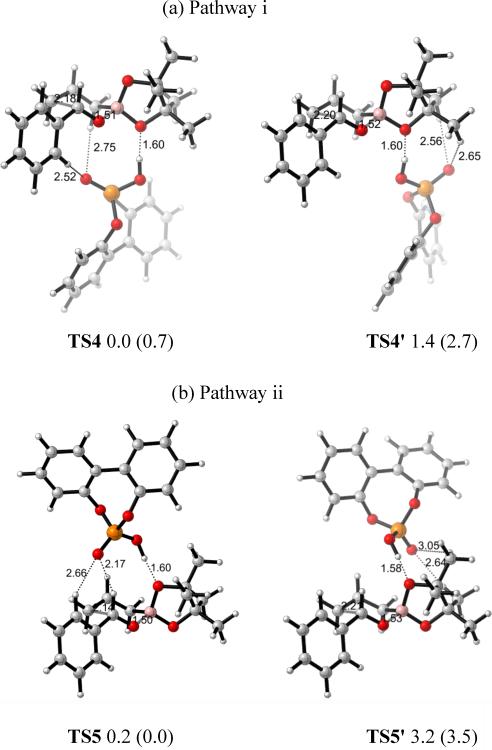
Figure 6.
Optimized transition state structures of (a) TS4, TS4' in pathway i (eq) and (b) TS5, TS5' in pathway ii (ax) at the B3LYP/6–31G* level of theory. Bond lengths are given in Å. Values next to each structure are energies relative to TS4 in kcal/mol. Values in parentheses are energies relative to TS5 calculated by B3LYP-D3.

