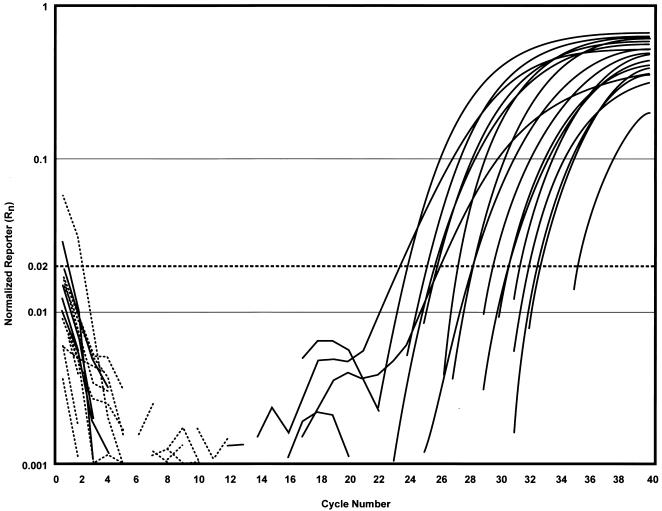
FIG. 3.
Amplification plot (Rn versus cycle number) of 23 bovine fecal samples obtained from the NVSL by IMS-real-time PCR using TaqMan chemistry. A double-blinded study was performed on the bovine fecal samples obtained from the NVSL for detection of M. avium subsp. paratuberculosis by using IMS and organically extracted DNA for real-time PCR analysis. The CT is the cycle at which a statistically significant increase in normalized reporter is first detected. The dashed line indicates the position of the noise band (Rn = 0.02). All the positive samples (solid-line amplification plots) had Rn values 10 times greater than the noise band, or baseline. All the negative samples (broken lines) were clearly below the noise band.

