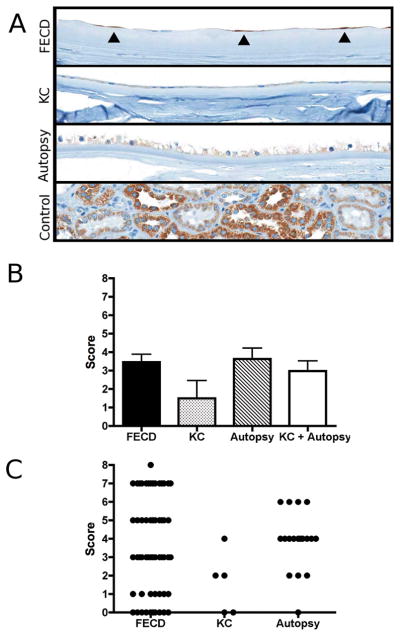
Figure 3.

Immunohistochemical staining of p16 protein on tissue microarray (TMA) section: A) Microscopic image of corneal endothelium from Fuchs endothelial corneal dystrophy (FECD), keratoconus (KC) and ocular autopsy specimens (original magnification 200x). Scattered endothelial cells of several FECD specimens showed p16 expression (marked by closed triangles). P16 expression among endothelial cells from KC and autopsy corneas was fainter, though more uniform. Bottom image shows non-ocular positive control tissue (kidney). B) Endothelial p16 expression was scored using a modified scoring system previously described by Bhutto et al.[17] The bar diagram depicts mean values ± SEM. C) Scatter plot of the individual scores for each evaluable core on TMA.
