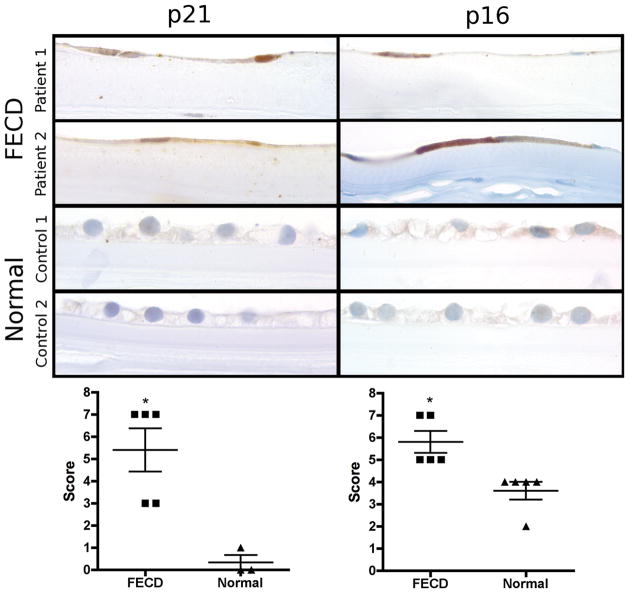
Figure 4.
Immunohistochemical staining of p21 and p16 protein on whole corneal tissue sections: Panel of microscopic images presents two examples of endothelial p21 and p16 expression in FECD and normal corneas, respectively (original magnification 1000x). Top and second row show FECD specific flattening of corneal endothelial cells and their nuclei due to cell loss with p21 positive (left column) and p16 positive (right column) cells. The normal corneal endothelium (third and bottom row) shows no or only (very) weak staining for p21 (left column) and p16 (right column). Scatter plots show p21 (left) and p16 (right) expression-levels of each individual specimen analyzed (scored according to Bhutto et al.[17]), horizontal lines indicate means ± SEM (*p<0.05)

