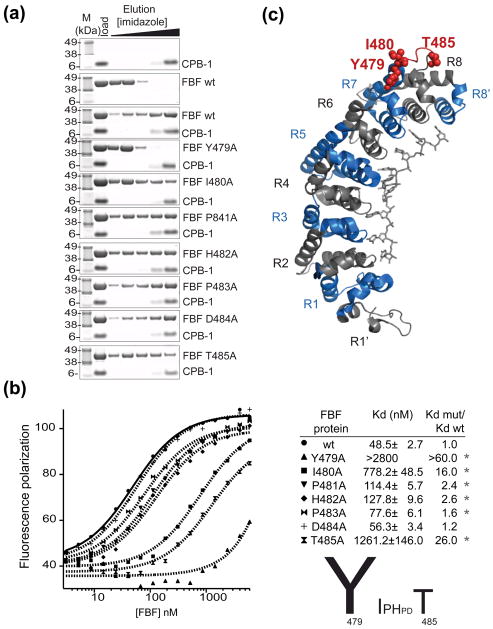
Figure 4. Identification of FBF-2 amino acids that are necessary for the interaction with CPB-1.
(A) Single alanine FBF mutants were tested for biding to CPB-1 with the NiNTA pulldown assay. The first two panels show the controls with CPB-1 or FBF only, mutation of FBF Tyr 479 to Ala completely disrupted the interaction with CPB-1 (forth panel). (B) The affinity of fl-CPB-1 for FBF wild-type and FBF alanine mutants was determined by fluorescence polarization assays. Fluorescence polarization is plotted as a function of FBF concentration and fitted to the Hill equation to determine the apparent equilibrium dissociation constant Kd,(shown in the table; the Hill coefficient was set to 1). The significance (* P-value <0.05) was determined by Student-t-test versus wild type FBF. A graphical summary of the effect of single alanine mutations in the Y479-T485 loop is shown. (C) FBF residues that affect binding to CPB-1 are highlighted in the crystal structure of FBF-2 in complex with PME RNA29. The 8 PUF repeats (R1–R8) are colored blue and grey, the loop connecting repeats seven and eight encompassing residues 479–485 is in red, key residues for the interaction with CPB-1 are shown as spheres.

