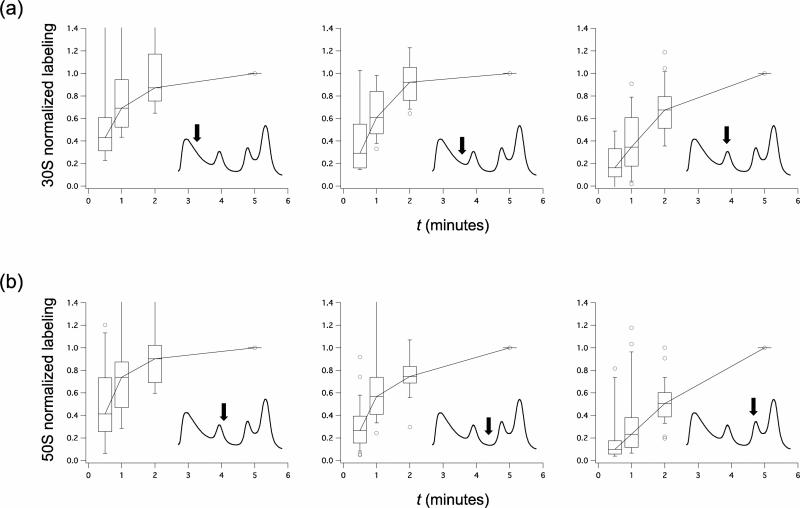
Fig. 3.
Adjusted short-time pulse-labeling kinetics of wild-type ribosomal particles. (a) 0.5, 1, 2, and 5 minutes normalized pulse-labeling kinetics (see Experimental Procedures) for representative fractions (marked by arrows) of the early pre-30S, late pre-30S, and 30S regions of wild-type ribosomal particles resolved over a sucrose gradient. The boxes in the plot indicate the second and third quartiles, and the whiskers indicate the 10th and 90th percentiles. Outliers are indicated as open circles. (b) 50S short time pulse-labeling. See also Supplemental Fig. 3 for the normalized pulse-labeling kinetics of individual r-proteins from each in vivo assembly groups.

